Pilot projects: co-development with industry
Our 3D MT inversion technology has been validated with published data (TRL 5), and we are now looking for companies and contractors with MT data to pilot it on real projects.
What you get
- 3D inversion of your data with our technology
- Model, visualizations and final report
- Early access and direct work with the technical team
What we ask
- MT data from a real project
- Feedback on the results and the process
Our technology
Our modeling is built on in-house technology that combines deep learning with an approach inspired by Bayesian statistics, to explore different models consistent with the data. The uncertainty quantification this approach enables is under validation.
Why a Bayesian approach
In magnetotellurics, different subsurface models can explain the same data. A deterministic inversion returns a single solution: one model that fits the data. The Bayesian approach instead explores the set of models consistent with the data and adds what a single solution does not tell you: which parts of the model can be trusted and which structures are most likely. This uncertainty quantification is under validation.
Deterministic inversion
- A single model as the answer
- Regularization smooths the model
- No indication of how reliable each zone is
Bayesian approach
- An ensemble of models consistent with the data
- An estimate of the uncertainty of each zone
- Shows when the data allow more than one interpretation
Illustrative schematic. Each dot represents a model that fits the data. If the dots cluster, that part of the model is reliable; if they spread out, it is uncertain.
Development status
The technology is at TRL 5 (component validation in a relevant environment) and we are working toward TRL 6, improving its robustness and validating it with industry data. We are looking for companies and contractors with MT data interested in co-developing the final solution; if that is your case, you can book a discovery call.
It was validated with the published magnetotelluric data from Lastarria volcano, northern Chile (Díaz et al., 2015): 30 stations and 18 periods, with the XY and YX components. The recovered 3D model shows reasonable agreement with the published model and with the observations.
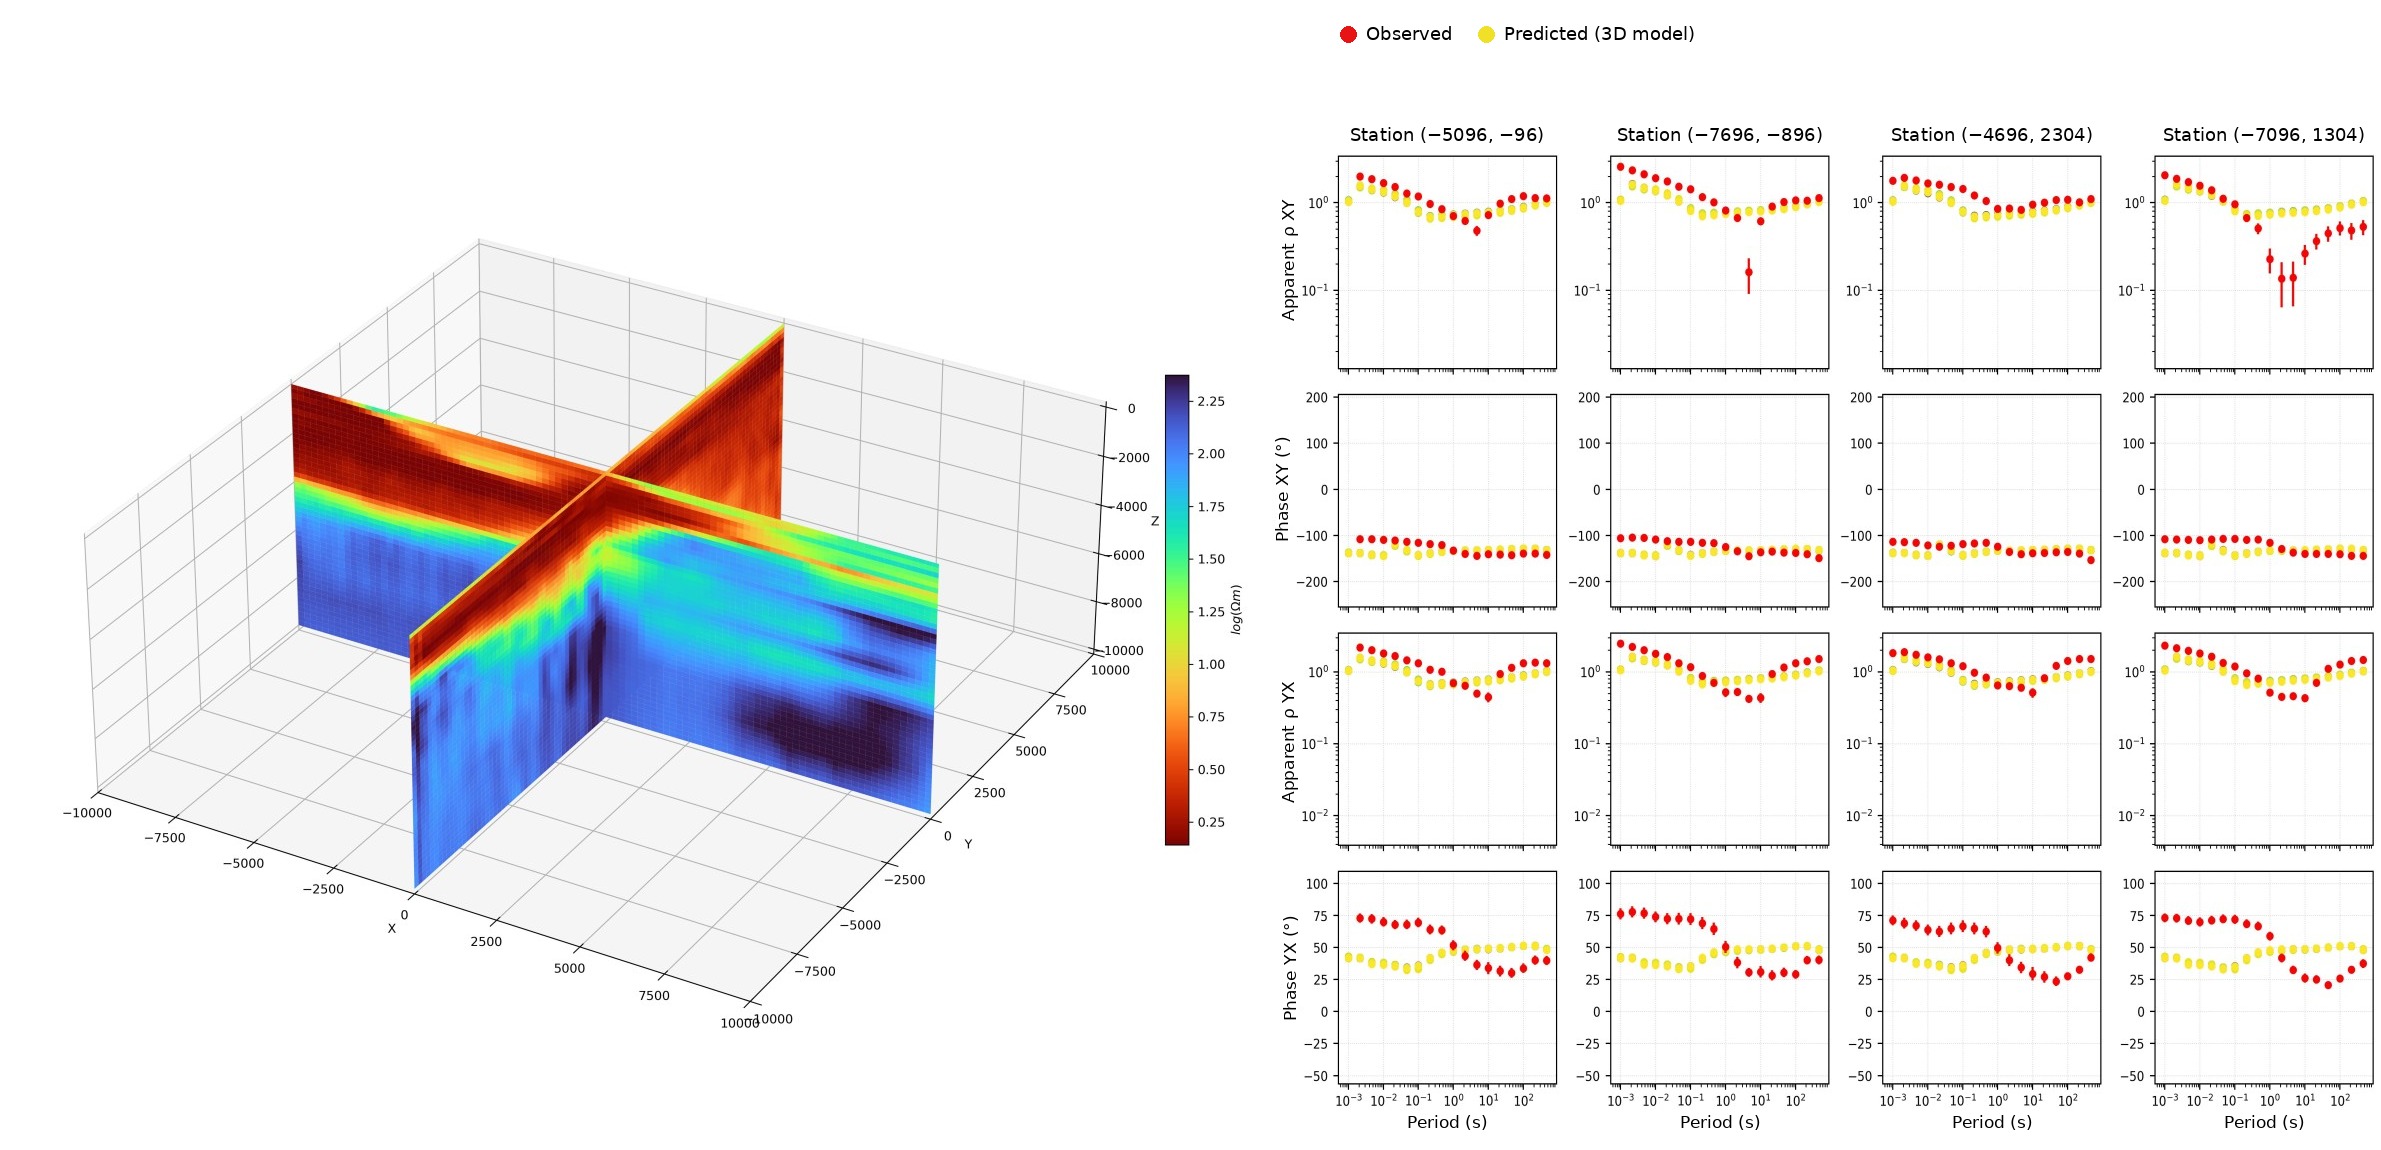
Left: EW and NS resistivity profiles of the 3D model (log₁₀ Ω·m; coordinates in meters). Right: observed (red) and model-predicted (yellow) apparent resistivity and phase at four stations, for the XY and YX components.
Compared with the published model:
- Resistivity values span a comparable range, roughly 1 to 1000 Ω·m, and increase toward the east.
- High-conductivity bodies extend to about 4 km depth.
Reference: Díaz, D., Heise, W. and Zamudio, F. (2015). Three-dimensional resistivity image of the magmatic system beneath Lastarria volcano and evidence for magmatic intrusion in the back arc (northern Chile). Geophysical Research Letters, 42(13), 5212–5218. doi:10.1002/2015GL064426